
TTE methods: manuscript and statistical analysis plan text
Source:vignettes/tte-methods.Rmd
tte-methods.RmdThis vignette provides drop-in text describing the target trial
emulation (TTE) methodology implemented in the swereg-TTE
family of functions (TTEEnrollment, TTEPlan,
and friends), for both the intention-to-treat (ITT) and the per-protocol
(PP) estimand. It has four sections:
- Statistical analysis plan (Section 1): detailed, self-contained, and implementation-agnostic, with formulas, per-step model specifications, conventions, identifying assumptions, and known limitations, written so a statistician who has never seen this package could reimplement the estimator. Designed to be copied whole into a pre-registered SAP, a protocol appendix, or a methods supplement, with section numbering that survives the copy.
-
Manuscript methods (Section 2): short, prose-only,
suitable for the main body of a journal article. Copy, paste, and
replace the
treatment/outcome/confounderplaceholders. - Validation evidence (Section 3): the numbers, including the design of the validation battery, the data-generating processes, and tables and figures of truth against estimate for every validation cell, rendered from a results artifact rather than asserted in prose.
- Implementation mapping (Section 4): the code behind the SAP, showing which function, argument, option, and test file realises each SAP step, plus provenance notes on estimator changes.
Every formula and convention in Section 1 describes what the code actually computes; where the implementation deviates from a canonical reference construction, the deviation and its rationale are stated explicitly. The implementation follows the sequential-trial-emulation literature (Hernán and Robins 2008; Danaei et al. 2013; Hernán and Robins 2016; Caniglia et al. 2023; Cashin et al. 2025).
1. Statistical analysis plan
This section specifies the estimators exactly as implemented, in pipeline order, in implementation-agnostic terms, so that the plan can be used as a standalone document. Simulation evidence supporting its quantitative statements is reported in the validation documentation that accompanies the software. Notation: individuals ; sequential trials indexed by their calendar baseline band ; follow-up bands within a trial , each of fixed width weeks (four by default). Let indicate being on the protocol-defined treatment in band , with the assigned baseline arm; the confounder vector as most recently updated at band , with its baseline value; the outcome indicator; and the indicator of artificial censoring (protocol deviation or loss to follow-up) in band .
1.1 Sequential enrollment, new-user requirement, and matching
Calendar time is partitioned into consecutive bands of width ; each band opens one trial. Within a band, a person’s arm is classified as intervention if the person is on the intervention treatment in at least one eligible week of that band, and as comparator if the person is on the comparator treatment throughout; person-bands with treatment status outside the two protocol arms are ineligible for that band. The band width is a bias–feasibility tradeoff: coarser bands admit residual within-band immortal time (Caniglia et al. 2023), which shrinks as decreases.
Eligibility (inclusion windows, exclusion criteria with lifetime or fixed-width look-back windows) is re-evaluated at every band. The design does not impose a new-user rule automatically: the incident-user design is produced by a protocol-specified washout exclusion on the treatment history, either a finite look-back window (e.g. 104 weeks, the Danaei et al. 2013 convention) or the entire observable history, for a never-user design. A lifetime washout makes each person eligible to initiate in at most one band and removes them from later trials; a finite washout additionally allows re-qualification after sufficient time off treatment. A protocol without any washout exclusion enrols prevalent users as initiators at every band and re-enrols discontinuers as comparators, a prevalent-user design that is rarely the intended estimand; the software warns when a specification omits the washout.
Within each band, all intervention person-trials are enrolled and comparators are randomly downsampled at a fixed matching ratio per initiator (2:1 by default, with a pre-specified seed). This sampling bounds computation and is not covariate matching; all confounding adjustment is deferred to the weights (1.4). Each enrolled person-trial is expanded to follow-up bands; within each band, confounders take their first-week value, outcomes are the within-band maximum, and person-time is the number of observed source weeks in the band, so that partially observed bands contribute their true person-time.
1.2 Estimands
Both estimands are marginal incidence rate ratios, standardised over the enrolled trials’ baseline covariate distribution through the weights:
- Intention-to-treat analogue: the contrast of initiating versus not initiating at baseline, ignoring subsequent switching. Identified under baseline exchangeability given , together with the assumptions in 1.9; estimated with the treatment weight alone.
- Per-protocol: the contrast of sustained treatment versus sustained non-treatment. Follow-up is censored at the first deviation from the assigned strategy; identified under the additional assumption that the censoring model captures all joint determinants of deviation and outcome; estimated with the product of treatment and censoring weights.
Interpretation under non-proportional hazards. The reported
IRR is the coefficient of a proportional-rates working model. When the
true marginal rate ratio varies over follow-up (for example under
depletion of susceptibles, or with effects that accumulate over time),
the single IRR is a person-time-weighted average of the time-varying
rate ratio — a well-defined summary, but one that can differ from, say,
the ratio of cumulative incidences over the full horizon. Simulations
with strongly time-varying effects show that swereg and
TrialEmulation produce the same weighted-average summary in
simulation. Where time-varying effects are of scientific interest,
follow-up-specific estimates (for example by follow-up horizon) should
be reported rather than the pooled IRR alone.
1.3 Follow-up construction and censoring events
For each person-trial, follow-up stops at the earliest of: (1) the first outcome event; (2) the first protocol deviation (PP only; the ITT panel never censors at switching); (3) the person’s end of observed data, when that occurs before any planned stop; (4) the pre-specified administrative end of study; and (5) the pre-specified analysis horizon.
Deviation is the first band in which the observed treatment status differs from the assigned arm (initiators off treatment; comparators on treatment); a band with missing on-treatment status counts as deviation. There is no grace period: deviation censors at the first mismatched band (a grace-period design would require cloning, which this pipeline does not implement; Hernán and Robins 2016).
Event-priority convention. If the first event and the first deviation fall in the same band, the person-trial exits through the event: the outcome is measured over the interval before within-interval censoring is applied, so the band counts as an event, not a censoring, in both the censoring model and the analysis data. The alternative convention, treating collision bands as censorings, discards real events and undercounts the per-protocol outcome in switching-heavy data.
Rows at and before the stop band are retained; censoring-event rows (their band person-time included) are removed from the analysis data after the censoring weights are estimated (1.5), so the analysis panel contains only protocol-consistent, at-risk person-time.
1.4 Baseline treatment weights (IPW)
On the baseline row of each person-trial, a logistic regression of assignment on the baseline confounders (main effects) is fit:
and the stabilised weight uses the marginal initiation fraction as numerator:
The weight is constant across a person-trial’s follow-up rows. Missing baseline confounders are singly imputed by hot-deck sampling from observed values (fixed seed) before the model is fit; imputation uncertainty is not propagated (1.8). The propensity model is main-effects only: if strong non-linearity or interactions are suspected, they must be encoded as derived confounder variables in the protocol specification.
1.5 Per-protocol censoring weights (IPCW)
Censoring (: deviation or loss in band ) is modelled on the panel before censoring-event rows are dropped. The default censoring model, fit separately by assigned arm , is a discrete-time logistic generalized additive model:
with penalised-spline smooth functions of follow-up band and of the trial index (a linear trial term when there are few bands; a fully linear-in-time specification is available as a pre-specified sensitivity option). The confounder columns carry their per-band updated values, so time-varying confounders, where available in the source data, inform the censoring model. Arm-specific fits fall back to the arm’s marginal censoring rate when a stratum has no (or all) censoring events or too few rows to support the model.
The stabilised weight for the row in band is a ratio of cumulative uncensored probabilities through band inclusive:
where is the numerator: the marginal mean uncensored probability at band within arm (by band only, when arms are pooled).
The construction deviates deliberately from the textbook version in two respects:
- Inclusive cumulative product. Because the censoring-event row is subsequently removed, a row present at band exists if and only if the person-trial is uncensored through ; the weight therefore includes band ’s own uncensoring probability. (With the convention that censored bands stay in the risk set, the product would stop at ; the two conventions must not be mixed.)
- Marginal numerator. Canonical stabilisation (Danaei et al. 2013) uses a numerator model conditional on baseline covariates, which then requires those covariates in the outcome model. Here the outcome model is covariate-free (marginal MSM, 1.7), so the numerator is the marginal uncensored probability by band and arm. This preserves consistency of the marginal estimand; it stabilises slightly less aggressively when baseline covariates strongly predict censoring.
1.6 Final analysis weights and truncation
for the per-protocol panel; for the ITT panel. Weights are truncated at percentiles (1st/99th by default) of the pooled person-band rows: the ITT weight directly, and the PP weight as the truncated product. Component-wise truncation is not applied, so extreme components can offset; sensitivity analyses may truncate components separately. Primary analyses use truncated weights; untruncated PP results are exported alongside as a sensitivity analysis.
Positivity and the truncation tradeoff. Weight truncation is a bias–variance tradeoff: clipping the weight tails stabilises the estimator (reducing its variance), but under-corrects whatever confounding or selection the clipped weights were carrying, and the under-correction displaces the estimate — toward the null under near-violations of treatment positivity, and by an amount that grows with how strongly measured covariates drive censoring.
Why the truncated weight is the primary analysis. The choice is pre-specified on simulation evidence rather than convention; the supporting simulation study is reported in the validation documentation. Across every per-protocol validation scenario — including regimes with heavy, strongly covariate-driven loss to follow-up — the truncated fit had the smaller sampling spread, its bias remained bounded, and its root-mean-squared error was lower than or practically equal to that of the untruncated fit; the untruncated fit, while less biased on average when the censoring weights were heavy-tailed, paid for it with severalfold larger sampling spread and, in some regimes, the larger bias as well. The untruncated result is therefore reported as a mandatory companion rather than an alternative primary: a material divergence between the two estimates indicates that the weights are under stress, and should prompt inspection of the raw weight distribution and of treatment and censoring positivity, sensitivity analyses at looser truncation percentiles, and — when extreme weights are structural (near-deterministic treatment or dropout within a stratum) — restriction of the eligible population rather than tighter truncation.
1.7 Outcome model
The IRR is estimated by a weighted quasi-Poisson marginal structural model on the analysis panel:
fit by weighted quasi-Poisson regression with survey-linearised variance. is a natural cubic spline of follow-up band (the discrete-time baseline-rate analogue); is a natural spline of the trial index with 3 df (linear when 2–4 bands; omitted for a single band), adjusting smoothly for calendar trends while sharing one treatment coefficient across trials (Danaei et al. 2013; Caniglia et al. 2023). No confounders enter the outcome model: is the marginal IRR.
Rate-ratio scale and hazard-ratio interpretation. With events rare within each band, as is typical of registry-based emulations, the incidence rate ratio from the discrete-time Poisson working model approximates the hazard ratio from a proportional-hazards model (Thompson 1977), while remaining computationally feasible on panels of millions of person-bands where weighted Cox estimation would be prohibitive. The quasi-Poisson variance function accommodates overdispersion, including that induced by the weights. Descriptive weighted event counts, person-years (52.25 weeks/year), and rates per 100,000 person-years accompany each IRR.
1.8 Inference
Standard errors are survey-linearised (Huber–White sandwich) with clustering on the person identifier, not the person-trial, accounting for repeated person-trials and repeated bands within person (Hernán and Robins 2008; Danaei et al. 2013; Su et al. 2024). Confidence intervals are Wald on the log scale, . Two caveats apply:
- The variance treats the estimated weights (and the hot-deck imputation) as fixed. For stabilised weights this is typically slightly conservative for the treatment coefficient, but it is not exact; a person-level bootstrap of the entire pipeline is the fuller alternative for definitive reporting.
- Monte Carlo calibration by simulation shows near-nominal coverage where the estimand’s assumptions hold, mild undercoverage under confounding with independent loss, and coverage degradation driven by bias, not by the variance estimator, when an estimand ignores informative loss.
1.9 Identifying assumptions
For the intention-to-treat analogue: (1) consistency; (2) no
unmeasured confounding of baseline assignment given the baseline
confounders at each trial’s baseline; (3) positivity of assignment
within confounder strata; (4) loss to follow-up independent of the
outcome. No censoring weights are applied to the ITT panel; simulation
shows the estimand holds under independent loss and is biased under
informative loss, in swereg and TrialEmulation alike.
For the per-protocol estimand, additionally: (5) the censoring model (1.5) captures all joint determinants of protocol deviation/loss and the outcome, including their time-varying values as materialised in the source data; (6) positivity of continued adherence. Under strong treatment–confounder feedback the single-model IPCW approach retains residual bias: time-updated censoring covariates remove part, not all, of the deviation selection bias relative to freezing them at baseline (quantified by simulation); where feedback is central, methods designed for treatment-confounder feedback (g-methods: the parametric g-formula or g-estimation of structural nested models), which this pipeline does not implement, are indicated. Similarly, adherence or loss driven by unmeasured prognostic factors (for example a healthy-adherer mechanism) violates (5), biases the per-protocol estimand in any implementation, and is not detectable from weight diagnostics; it must be addressed by design, for example through negative-control outcomes or sensitivity analyses for unmeasured selection.
1.10 Heterogeneity, subgroups, and small cells
Effect heterogeneity across calendar time is tested by a joint Wald test of the treatment × trial-index spline interaction; effect modification by pre-specified baseline subgroups by treatment × subgroup interaction, with stratified IRRs per level. Zero-event strata return no estimate rather than an unstable one. Enrollments and outcomes are pre-specified in a machine-readable study specification; results tables report weighted events, person-years, rates, IRR, CI, and p-value per estimand, plus CONSORT-style attrition (unique persons and person-trials separately, per Cashin et al. 2025).
1.11 Known limitations
- No grace periods and no cloning; deviation censors at the first mismatched band (1.3).
- No as-treated estimand.
- Single hot-deck imputation of missing baseline confounders (no variance propagation).
- Comparator downsampling (1.1) discards comparator information (efficiency, not bias).
- The propensity and censoring models are main-effects (plus smooth time) specifications; non-linearities must be pre-encoded as derived variables.
2. Manuscript methods
We applied target trial emulation, a framework for analysing
observational data under explicit protocols that mirror a hypothetical
randomized trial, to estimate the effect of treatment on
outcome in the Swedish national health registries (Hernán
and Robins 2008, 2016; Cashin et al. 2025).
Sequential trials design
Because eligible individuals can initiate treatment at many different
calendar times, we emulated a sequence of target trials rather than a
single trial (Hernán et al. 2008; Danaei et al. 2013; Caniglia et
al. 2023). A new trial opens every period weeks of calendar
time. At each trial’s baseline, all eligibility criteria are
re-evaluated; eligible individuals enter as initiators (treatment begins
in that trial’s baseline period) or as non-initiators (eligible and
untreated). A new-user (washout) criterion requires no use of the study
treatment within a pre-specified washout window before baseline (a fixed
window, e.g. two years as in Danaei et al. 2013, or the entire
observable history for a never-user design), so each person initiates in
at most one trial while contributing eligible person-time as a
non-initiator to earlier trials. Anchoring time zero at eligibility and
assignment — rather than at eventual exposure — prevents immortal time
bias (Hernán and Robins 2016). To bound computation, k
non-initiators were sampled per initiator within each trial; confounding
adjustment is by weighting (below), not by matching on covariates.
Estimands
We report two estimands (Danaei et al. 2013). The observational analogue of the intention-to-treat effect compares initiators with non-initiators as classified at each trial’s baseline, ignoring subsequent changes in treatment. The per-protocol effect is the effect of sustained treatment versus sustained non-treatment; for this estimand, follow-up is artificially censored when a participant’s treatment status first deviates from the baseline-assigned strategy. Both are reported as marginal incidence rate ratios (IRRs), with weighted event counts and rates per 100,000 person-years by arm.
Confounding and censoring adjustment
Baseline treatment assignment is not random: we adjusted for measured
baseline confounders (confounders) by stabilised inverse
probability of treatment weighting, estimated from a logistic model at
each trial’s baseline (Hernán and Robins 2008). For the per-protocol
estimand, artificial censoring at protocol deviation is informative
whenever time-varying factors predict both adherence and the outcome; we
therefore additionally applied stabilised inverse probability of
censoring weights from discrete-time censoring models fit separately by
assigned arm, with a smooth function of follow-up time and the most
recently updated covariate values (Hernán and Robins 2008; Danaei et
al. 2013). Weights were truncated at the 1st and 99th percentiles to
limit the influence of extreme values (Danaei et al. 2013); analyses
with untruncated weights were pre-specified as a sensitivity analysis,
with divergence between the two interpreted as an indicator of weight
instability.
Outcome model and inference
We fit a weighted quasi-Poisson marginal structural model of the event indicator on assigned baseline treatment with log person-time as offset, including natural splines of follow-up time and of the trial (calendar) index; the exponentiated treatment coefficient estimates the marginal IRR pooled across sequential trials, which approximates the marginal hazard ratio when events are rare (Thompson 1977). Because individuals contribute repeated observations within and across trials, confidence intervals use cluster-robust (sandwich) standard errors clustered on the person (Hernán and Robins 2008; Danaei et al. 2013). Effect heterogeneity across calendar time and pre-specified subgroups was assessed by Wald tests of the corresponding interaction terms.
Software
Analyses used R with the swereg package, which
implements the sequential enrollment, weighting, and estimation pipeline
described above; censoring-weight models were fit with
mgcv, and the final weighted regression with cluster-robust
variance with survey::svyglm(). The implementation is
validated against simulated data with known true effects and against the
TrialEmulation package (Su et al. 2024); the validation
suite runs in continuous integration.
3. Validation evidence
All numerical results in this section, in the prose as well as in the tables and figures, are computed directly from a results artifact rather than transcribed by hand. The artifact is produced by rerunning the complete validation battery: the same data-generating processes, truth calculations, and fit wrappers that the package’s test suite enforces in continuous integration. Section 4.3 maps each layer to its test file and describes how to regenerate the artifact.
Provenance: generated 2026-07-04 17:24:46 UTC with swereg 26.7.4, TrialEmulation 0.0.4.11, under R version 4.6.0 (2026-04-24).
3.1 Design of the validation battery
The battery is organised around one principle: an estimator is validated by recovering a truth that is known by construction, not by agreeing with another implementation. Agreement between two packages is used as corroborating evidence only: two correct implementations of the same estimand must agree, but two implementations can also agree while both miss the truth, and the battery deliberately includes a scenario (informative loss under the ITT estimand) that demonstrates exactly this.
Truth is therefore computed by direct counterfactual simulation. For each scenario and estimand, 200,000 persons per arm are simulated under the forced strategy (for the per-protocol truth, treatment is held at the assigned value in every period; for the ITT truth, only the baseline value is forced and subsequent treatment follows the scenario’s natural switching process), and the truth is the log ratio of first-event incidence rates, with events counted until each person’s first event and person-time accumulated only while at risk. Loss to follow-up is never applied to the truth simulation: loss is a nuisance the estimator must be robust to, not part of the estimand. This first-event, person-time-at-risk construction matches the estimand targeted by the weighted quasi-Poisson model (1.7) exactly; a recurrent-event or fixed-denominator construction would target a different quantity.
Four layers separate concerns, so that a failure localises to a pipeline segment:
| Layer | Pipeline segment exercised | Question answered |
|---|---|---|
| Cross-package matrix (3.3) | Enrollment-layer estimators (IPW, IPCW, weighted MSM) on person-period panels | Do swereg and TrialEmulation each recover known truth where the estimand’s assumptions hold, and fail identically where they do not? |
| Stress matrix (3.4) | The same estimators at design extremes | Does the estimator remain stable under rare outcomes, null and harmful effects, near-positivity violation, heavy informative attrition, and treatment-confounder feedback? |
| Plan-layer truth matrix (3.5) | The complete production pipeline: specification, banding, sequential eligibility, matching, worker subprocesses, dual analysis files | Does the pipeline as a whole recover a planted constant-hazard truth, including the separation of PP from ITT under discontinuation? |
| Coverage calibration (3.6) | The sandwich variance estimator | Do nominal 95% intervals cover the truth 95% of the time when the estimand is valid? |
Interpreting single-dataset cells requires one calibration: at the sample sizes used here, one simulated dataset carries Monte Carlo noise of roughly 0.03–0.05 on the log-IRR scale, so a single-run gap of that order is indistinguishable from zero. All cells run at fixed seeds and are therefore exactly reproducible; the multi-replicate cells (Tables 5, 8, and 13–17) quantify bias and coverage across repeated draws, free of this caveat.
3.2 Enrollment-layer scenarios: data-generating processes
The enrollment-layer cells (3.3, 3.4) share one person-period data-generating process. For person with standard-normal baseline confounder and periods :
with true contemporaneous treatment effect unless a cell varies it. The persistence coefficient of 8 keeps most initiators on treatment (adherent person-time dominates) while still generating enough switching to separate the PP and ITT truths. Loss to follow-up, when present, is geometric dropout from a per-person hazard: constant at 0.06 per period (independent loss), or (informative loss, so that dropout selects on the confounder that also drives treatment and outcome). The three standard scenarios switch the nuisance parameters only, leaving the true effect identical:
| Scenario | Loss to follow-up | What it induces | |||
|---|---|---|---|---|---|
| s1 | 0 | 0 | 0 | none | clean benchmark: no confounding, no selection |
| s2 | 0.6 | 0.4 | 0.4 | independent (hazard 0.06) | baseline confounding plus outcome-independent attrition |
| s3 | 0.6 | 0.4 | 0.4 | informative (expit(-1.4 + 0.9 L0)) | baseline confounding plus attrition that selects on the confounder |
Each scenario dataset is simulated at 20,000 persons and 20 periods with a fixed seed. Table 3 reports the realized characteristics of the exact datasets analysed in 3.3.
| Scenario | Persons | Person-periods | Person-periods lost | Initiators at baseline | Persons with ≥1 event | Event risk per period |
|---|---|---|---|---|---|---|
| s1 | 20,000 | 400,000 | 0% | 43.0% | 6,692 | 2.05% |
| s2 | 20,000 | 236,519 | 41% | 44.0% | 4,300 | 2.18% |
| s3 | 20,000 | 197,823 | 51% | 44.0% | 3,328 | 1.93% |
3.3 Cross-package validation matrix
Each scenario dataset is fed through the full triangle (known
potential-outcome truth, swereg, and TrialEmulation) for
both estimands. Estimates are compared on a common rate-ratio scale:
TrialEmulation reports odds ratios from pooled logistic
regression, which are converted with the Zhang–Yu relation using the
reference arm’s per-period event risk from the truth simulation (Zhang
and Yu 1998; Section 3.7). TrialEmulation is a peer
required to recover the truth itself, not an oracle.
| Scenario | Nuisances | Estimand | True log-IRR | swereg [95% CI] | TrialEmulation [95% CI] | swereg bias | TE bias | swereg − TE |
|---|---|---|---|---|---|---|---|---|
| s1 | none | pp | -0.687 | -0.720 [-0.774, -0.666] | -0.708 [-0.764, -0.653] | -0.032 | -0.021 | -0.011 |
| s1 | none | itt | -0.473 | -0.499 [-0.549, -0.449] | -0.499 [-0.549, -0.449] | -0.026 | -0.026 | -0.000 |
| s2 | confounding + independent loss | pp | -0.659 | -0.649 [-0.717, -0.581] | -0.662 [-0.731, -0.593] | +0.011 | -0.002 | +0.013 |
| s2 | confounding + independent loss | itt | -0.444 | -0.473 [-0.537, -0.409] | -0.480 [-0.544, -0.417] | -0.029 | -0.036 | +0.007 |
| s3 | confounding + informative loss | pp | -0.659 | -0.604 [-0.689, -0.520] | -0.680 [-0.759, -0.601] | +0.055 | -0.020 | +0.075 |
| s3 | confounding + informative loss | itt | -0.444 | -0.535 [-0.610, -0.459] | -0.544 [-0.619, -0.469] | -0.090 | -0.099 | +0.009 |
In Table 4, every interval in a cell whose assumptions hold covers the truth; the per-protocol estimator remains close to the truth in s3 precisely because its censoring weights (1.5) model the informative loss; and in the s3 ITT cell both packages miss on the same side (swereg -0.090, TrialEmulation -0.099) while agreeing with each other to within 0.009. A single dataset nonetheless provides limited evidence: at N = 20,000 one estimate carries Monte Carlo noise of roughly 0.03–0.05 on the log-IRR scale, so point estimates deviate visibly from the truth even under a perfectly unbiased estimator, and the size of any one gap is determined by sampling variation alone. A stronger assessment is obtained by replication: the full triangle is repeated on 20 independent datasets per scenario, which reduces the Monte Carlo standard error of the estimated bias by a factor of .
| Scenario | Estimand | Datasets | True log-IRR | swereg, truncated weights: mean bias (MC SE) | swereg, untruncated weights: mean bias (MC SE) | TrialEmulation: mean bias (MC SE) | Mean |swereg − TE| |
|---|---|---|---|---|---|---|---|
| s1 | pp | 20 | -0.687 | -0.012 (0.006) | -0.012 (0.006) | -0.002 (0.006) | 0.010 |
| s1 | itt | 20 | -0.473 | +0.003 (0.005) | +0.003 (0.005) | +0.003 (0.005) | 0.000 |
| s2 | pp | 20 | -0.659 | +0.002 (0.010) | -0.008 (0.010) | -0.017 (0.010) | 0.019 |
| s2 | itt | 20 | -0.444 | -0.027 (0.009) | -0.034 (0.009) | -0.043 (0.009) | 0.016 |
| s3 | pp | 20 | -0.659 | +0.049 (0.010) | +0.019 (0.014) | -0.018 (0.010) | 0.067 |
| s3 | itt | 20 | -0.444 | -0.071 (0.009) | -0.079 (0.009) | -0.086 (0.010) | 0.016 |
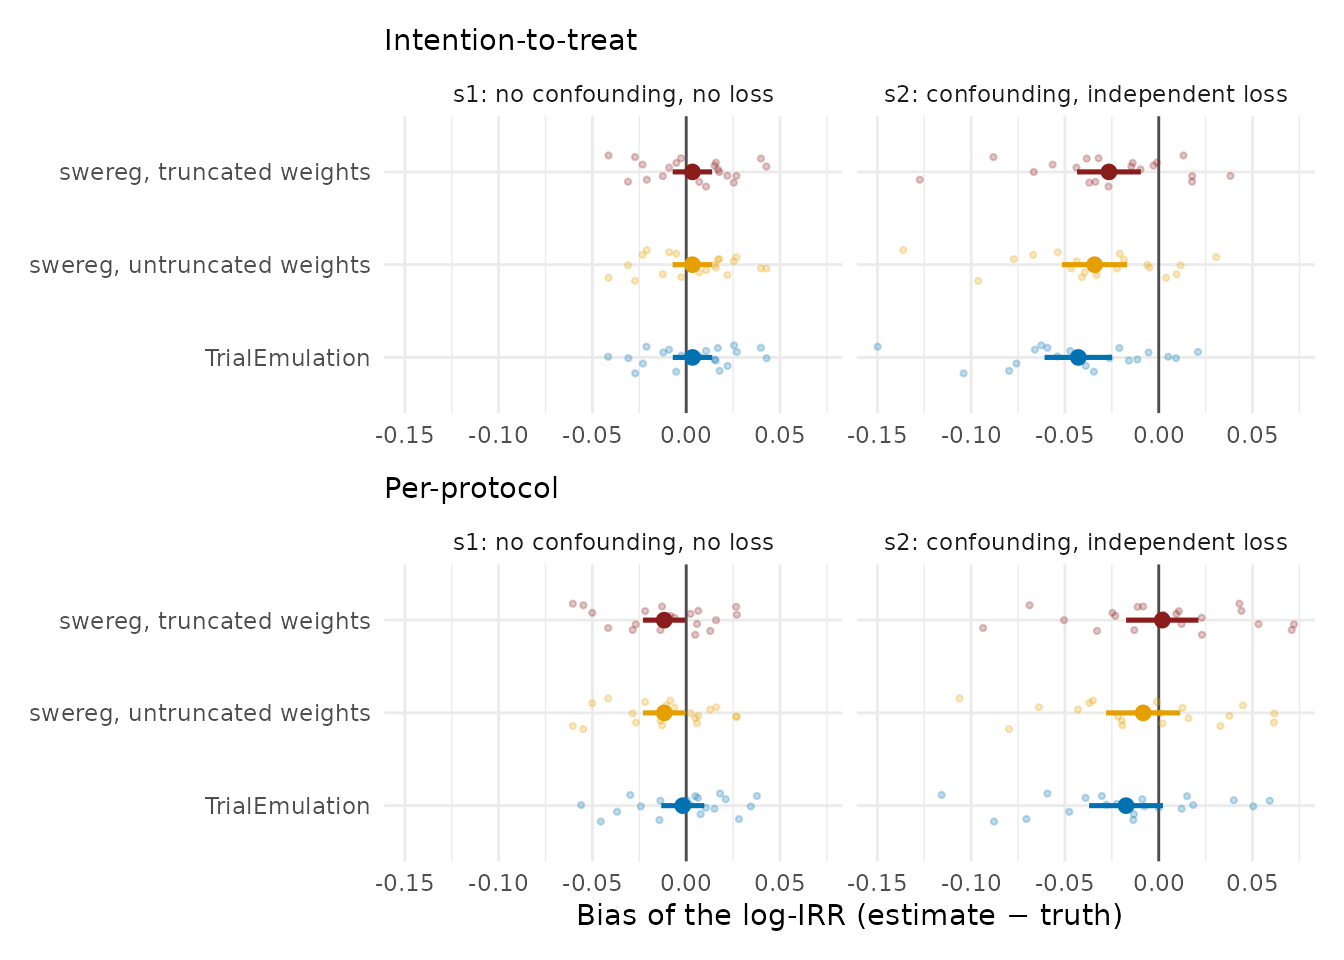
Figure 1. Bias of the estimated log-IRR over 20 independent datasets per scenario (N = 20,000 each) in the scenarios whose assumptions every fit satisfies: s1 (no confounding, no loss) and s2 (confounding, outcome-independent loss). Faint points are individual datasets; solid points are the mean bias with its 95% Monte Carlo interval; the vertical line marks zero bias. All three fits (swereg with truncated weights, swereg with untruncated weights, and TrialEmulation) are centred on zero in s1 and in the per-protocol cells; the small displacement in the s2 intention-to-treat cell is shared by every fit (largest for TrialEmulation) and is the person-time-weighting residual discussed in the text, not a property of any one implementation. The informative-loss scenarios, where the fits genuinely differ, are shown in Figure 2.
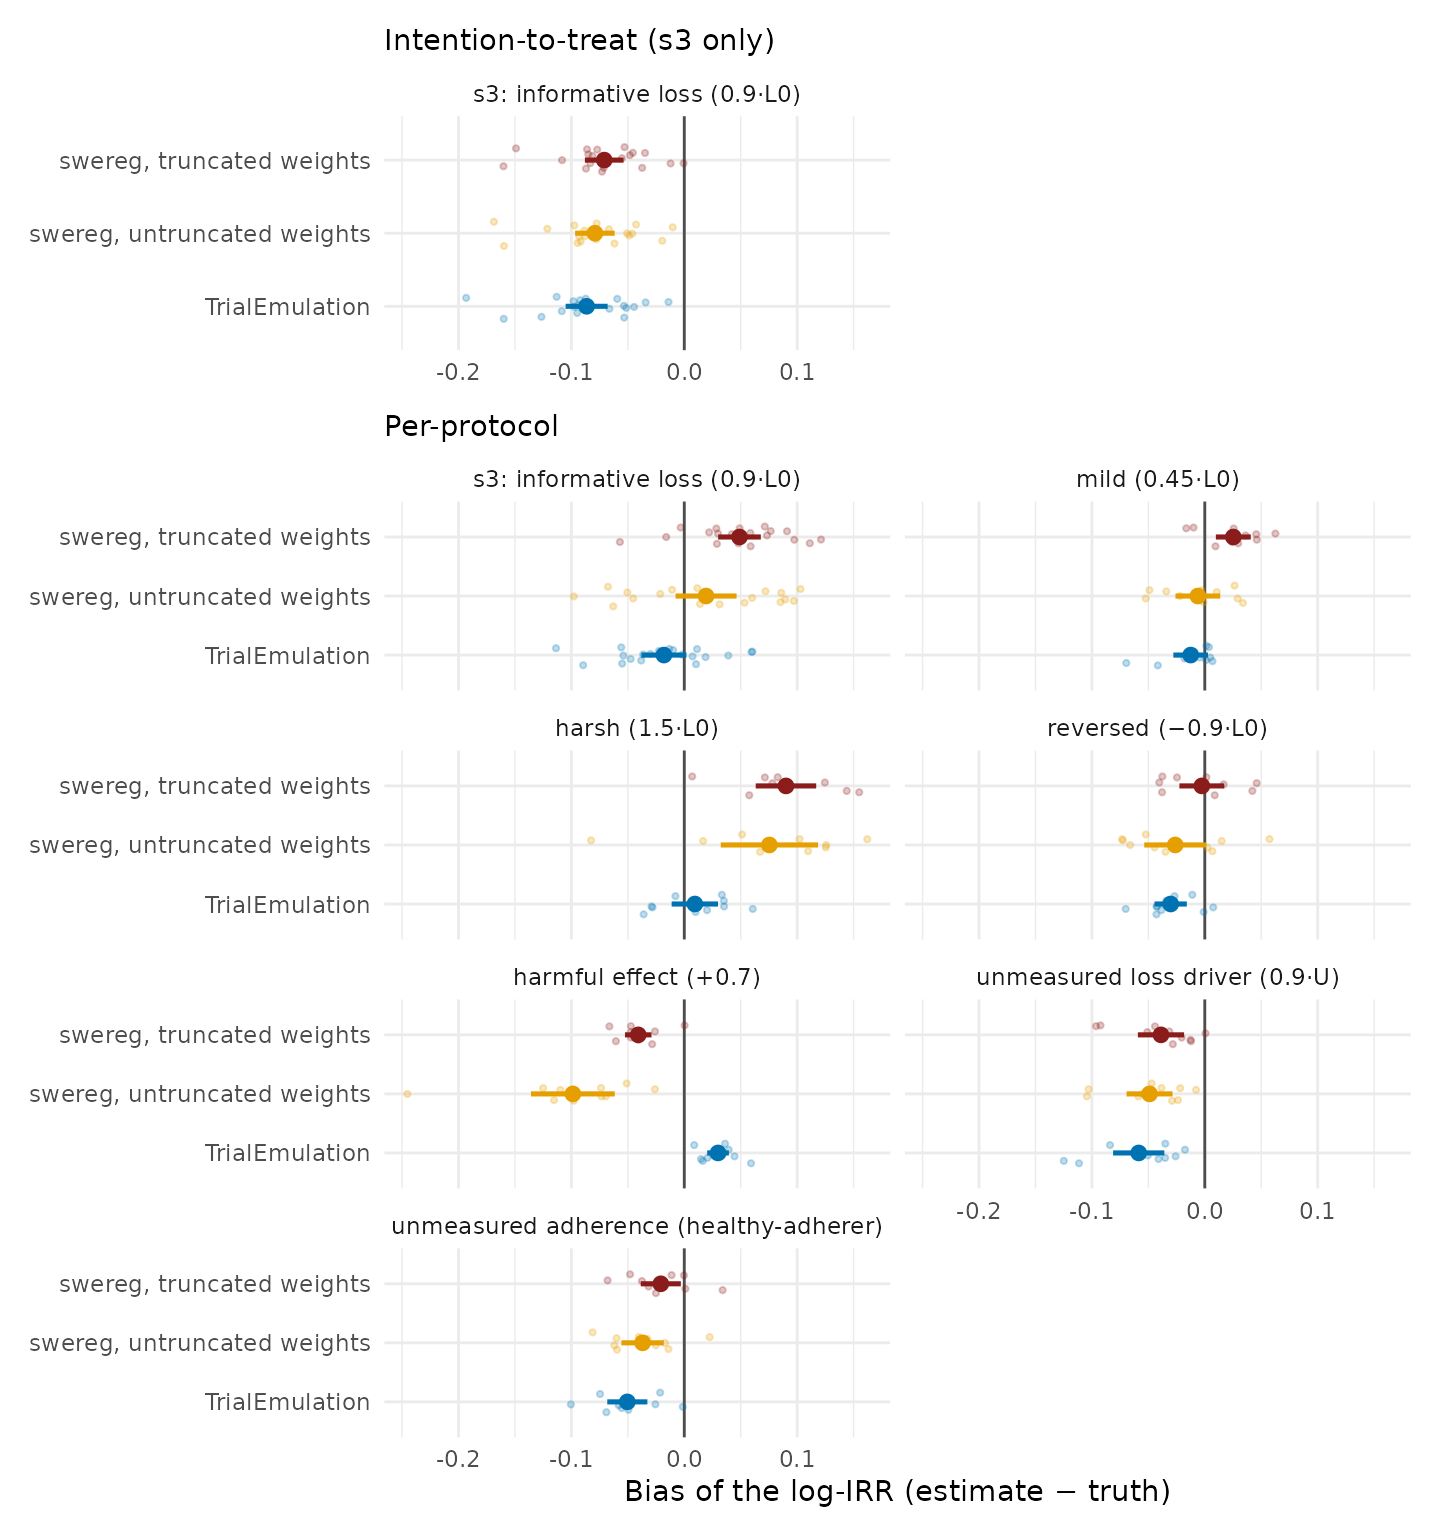
Figure 2. Bias under informative loss to follow-up, the scenarios in which the estimators differ materially: s3 and its one-parameter variants (designs in Table 16, Section 3.8; 20 datasets for s3, 10 per variant). Top panel: for the intention-to-treat estimand the informative loss violates the estimand’s own assumptions, and every fit is displaced; no estimation method corrects an invalid estimand. Bottom panel: for the per-protocol estimand the fits differ by how they correct the selection. TrialEmulation conditions on the baseline covariate that drives the loss, which is exact in these designs; swereg corrects the selection by censoring weights, and clipping them (truncation) adds an attenuation that grows with the informativeness of the loss; the ordering reverses in the reversed-selection and harmful-effect cells, and no fit has uniformly smaller bias (Section 3.8).
Averaging over 20 datasets reduces the Monte Carlo standard error of the estimated bias to roughly 0.010, fine enough to resolve systematic effects that no single dataset can. Three magnitudes emerge from Table 5 and Figures 1 and 2. In the clean scenario (s1) both packages are unbiased within Monte Carlo error for both estimands (mean bias of swereg’s truncated-weight fit at most 0.012 in absolute value): the estimation machinery itself introduces no bias. Where nuisances are present but the estimand remains valid (s2, and the per-protocol estimand in s3), small systematic residuals of up to 0.049 become resolvable in the truncated-weight fits: at most a 5% relative error on the rate-ratio scale, well inside the tolerances the test suite enforces, and reported here explicitly.
The truncated-versus-untruncated contrast localises the largest of these residuals. In the s3 per-protocol cell, the truncated-weight mean bias of +0.049 falls to +0.019 (MC SE 0.014) when the same replicates are refit with untruncated weights: most of the displacement is attributable to clipping the weights, the bias–variance tradeoff described in 1.6. Informative dropout means the high-risk individuals still under observation late in follow-up must carry large censoring weights to represent those who left; the 1st/99th-percentile truncation caps precisely those weights, and the under-corrected selection surfaces as bias toward the null. This is also why the untruncated per-protocol results are exported as a sensitivity analysis: a material divergence between the truncated and untruncated estimates indicates that truncation is attenuating the correction. The event-priority convention (1.3) is excluded as a cause by design contrast: the s2 per-protocol cell shares the identical switching, censoring, and event-accounting machinery, differs only in that its loss is non-informative, and shows no bias with the same truncated weights (+0.002). The remaining small residuals (for example in the s2 ITT cell) are consistent with loss truncating follow-up toward its early bands, so that the person-time-weighted working-model summary (1.2) no longer weights follow-up exactly as the no-loss truth functional does.
The s3 ITT cell is of a different kind: truncated-weight mean bias -0.071, roughly 8 Monte Carlo standard errors from zero and present in both packages. The displacement is one that replication sharpens rather than removes, because the ITT estimand carries no loss weight and informative loss therefore biases it in any correct implementation. Cross-package agreement is not evidence of correctness, which is why every layer of this battery is anchored to simulated truth.
3.4 Stress matrix
The stress cells reuse the Section 3.2 data-generating process with one or two parameters pushed to an extreme, so that each cell probes a specific failure mode. Table 5 specifies the designs; the cells then follow in order.
| Cell | Design deviation from the base DGP | What it probes |
|---|---|---|
| Rare outcome | Outcome intercept −6.0 (≈0.2% risk/period), N = 40,000, θ = −0.7 | Sparse-event stability of the weighted MSM and the spline IPCW model |
| Null effect | θ = 0, independent loss, N = 20,000 | False-positive effects (does the pipeline manufacture signal from noise?) |
| Informative attrition | Dropout hazard expit(−1.3 + 0.9 L0): ≈73% of person-periods lost, selecting on the confounder; N = 30,000 | IPCW under heavy selection; the ITT arm of this cell is expected to fail |
| Harmful effect, depletion | θ = +0.7, three independent seeds at N = 20,000, TrialEmulation cross-check | The person-time-weighted-average interpretation of the pooled IRR (1.2) |
| Near-positivity violation | φA = 1.5: propensity scores span 0–1; ITT fit at three truncation levels | The truncation bias-variance tradeoff (1.6) |
| Treatment-confounder feedback | AR(1) confounder Lt = 0.7 Lt−1 − 0.4 At−1 + εt driving both switching (0.8 Lt) and outcome (0.5 Lt); N = 25,000 | The residual-bias limit of single-model IPCW under feedback (1.9) |
| Determinism | Identical data, PP estimator fit twice | Uncontrolled stochastic steps anywhere in the fit |
| Cell | Estimand | True log-IRR | Estimate [95% CI] | Bias | CI covers truth | Note |
|---|---|---|---|---|---|---|
| rare_outcome | pp | -0.696 | -0.672 [-0.798, -0.546] | +0.024 | yes | event risk 0.18%/band |
| rare_outcome | itt | -0.435 | -0.421 [-0.534, -0.308] | +0.014 | yes | |
| null_effect | itt | 0.000 | 0.041 [-0.012, 0.094] | +0.041 | yes | true log-IRR = 0 |
| informative_attrition | pp | -0.659 | -0.649 [-0.746, -0.553] | +0.010 | yes | 73% of person-periods lost |
| informative_attrition | itt | -0.444 | -0.570 [-0.653, -0.488] | -0.126 | no | biased by design: no loss weight |
Three observations from Table 7. At an event risk of roughly 0.2% per period the per-protocol machinery, including the spline-based censoring model, remains stable (bias +0.024). Under a true null the estimate is small and its interval covers zero: the weighting and pooling machinery does not manufacture an effect. And in the attrition cell, where almost three quarters of person-periods are removed by confounder-driven dropout, the per-protocol estimator stays at the truth (bias +0.010) while the ITT estimator, which by construction carries no loss weight, is displaced (bias -0.126) and its interval excludes the truth: the designed failure that motivates the estimand distinction in practice.
Determinism: refitting the per-protocol estimator on identical data reproduced the estimate to a maximum absolute difference of 0; the pipeline has no uncontrolled stochastic step.
| Seed | True log-IRR (cumulative-rate) | swereg | TrialEmulation | swereg − truth | swereg − TE |
|---|---|---|---|---|---|
| 3001 | 0.393 | 0.479 | 0.502 | +0.086 | -0.023 |
| 3002 | 0.393 | 0.462 | 0.474 | +0.069 | -0.012 |
| 3003 | 0.393 | 0.464 | 0.478 | +0.071 | -0.014 |
Under a harmful effect with strong depletion of susceptibles, the
marginal hazard ratio declines over follow-up, so the single pooled IRR,
a person-time-weighted average (1.2), legitimately lies above the
cumulative-rate truth, by a mean of +0.075 across the three seeds. This
is a property of the estimand, not an implementation defect: swereg and
TrialEmulation agree to within 0.023 on every seed because
both target the same weighted-average summary. Analyses in which the
time path of the effect matters should report follow-up-specific
estimates.
| Truncation percentiles (%) | True log-IRR | Estimate | Bias (attenuation) | Max raw stabilised weight |
|---|---|---|---|---|
| 0.5 / 99.5 | -0.444 | -0.366 | +0.079 | 1325 |
| 1.0 / 99.0 | -0.444 | -0.330 | +0.114 | 1325 |
| 5.0 / 95.0 | -0.444 | -0.226 | +0.218 | 1325 |
Table 9 quantifies the tradeoff stated in 1.6 on a design whose propensity scores approach the boundary (maximum raw stabilised weight 1325): each tightening of the truncation percentiles reduces variance at the cost of measurable bias toward the null. When extreme weights are structural rather than sporadic, the appropriate response is to restrict the eligible population, not to truncate harder.
| Fit | True log-IRR | Estimate [95% CI] | Bias | |Bias| |
|---|---|---|---|---|
| pp, time-updated censoring covariate | -1.195 | -0.952 [-1.023, -0.881] | +0.244 | 0.244 |
| pp, covariate frozen at baseline | -1.195 | -0.908 [-0.977, -0.839] | +0.287 | 0.287 |
| itt | -0.373 | -0.398 [-0.442, -0.353] | -0.024 | 0.024 |
The feedback cell delineates the limit of the per-protocol estimator’s validity. When a time-varying confounder is itself affected by treatment and drives both adherence and the outcome, IPCW with time-updated covariates is strictly less biased than IPCW with covariates frozen at baseline (|bias| 0.244 versus 0.287), but a residual bias remains, part of which is the working-model average under a time-ramping effect rather than selection per se. The ITT estimand, which needs no censoring model against this feedback, is near-unbiased in the same data (bias -0.024). Where treatment–confounder feedback is central to the question, g-methods beyond this pipeline are indicated, exactly as stated in 1.9.
3.5 Full-pipeline truth recovery (plan layer)
The layers above validate the estimators on pre-built person-period panels. This layer validates everything that sits on top in production: the machine-readable specification, trial-band assignment, sequential eligibility with a lifetime new-user exclusion, per-band 2:1 comparator matching, the worker subprocess chain, the dual PP/ITT analysis files, and the pooled weighted outcome model.
The data-generating process plants an exactly known truth in a realistic skeleton. Persons are observed weekly from 2016-01-01 to 2021-06-30 — roughly 287 ISO weeks, deliberately spanning 2020’s 53-week ISO year, and are split into never-treaters and initiators; initiators start treatment at a band drawn uniformly from the first 56 four-week bands and, in the discontinuation cell, stop after a geometric duration (4% weekly hazard). The weekly outcome hazard is constant at 0.0025 untreated and doubled while treated, so the marginal per-week incidence rate ratio among sustained users is exactly 2.0. Scenario B adds a binary frailty carried by 30% of persons that doubles both the initiation probability and the outcome hazard, a genuine baseline confounder; mixture-averaging over the two risk groups with first-event depletion attenuates the marginal truth to 1.982. Loss, when present, is geometric (2% weekly, or 1%/3% by risk group for informative loss) and multiplies person-time equally in both arms, so the truth is unchanged and loss is purely a nuisance the machinery must tolerate. The ITT truth in the discontinuation cell (1.44) is simulated directly as the do(initiate)-versus-do(never) contrast with natural discontinuation.
| Cell | Scenario | Loss | Persons | Person-weeks | Treated person-weeks | Events |
|---|---|---|---|---|---|---|
| A_none | A | none | 9,000 | 2,592,000 | 793,304 | 8,431 |
| A_indep | A | independent | 15,000 | 744,146 | 84,813 | 2,104 |
| A_inform | A | informative | 15,000 | 1,138,469 | 194,282 | 3,377 |
| B_none | B | none | 9,000 | 2,592,000 | 944,408 | 11,636 |
| B_indep | B | independent | 15,000 | 749,636 | 102,388 | 2,850 |
| B_inform | B | informative | 15,000 | 1,142,150 | 180,994 | 3,790 |
| DISC | A | none | 9,000 | 2,592,000 | 110,516 | 6,643 |
| Cell | Loss | PP truth | PP IRR [95% CI] | covers | ITT truth | ITT IRR [95% CI] | covers |
|---|---|---|---|---|---|---|---|
| A_none | none | 2.00 | 2.04 [1.86, 2.24] | yes | 2.00 | 2.04 [1.86, 2.24] | yes |
| A_indep | independent | 2.00 | 2.07 [1.71, 2.51] | yes | 2.00 | 2.07 [1.71, 2.51] | yes |
| A_inform | informative | 2.00 | 1.95 [1.68, 2.26] | yes | 2.00 | 1.95 [1.68, 2.26] | yes |
| B_none | none | 1.98 | 1.89 [1.71, 2.07] | yes | 1.98 | 1.89 [1.71, 2.07] | yes |
| B_indep | independent | 1.98 | 1.81 [1.50, 2.19] | yes | 1.98 | 1.85 [1.54, 2.23] | yes |
| B_inform | informative | 1.98 | 1.95 [1.69, 2.26] | yes | 1.98 | 1.87 [1.62, 2.17] | yes |
| DISC | none | 2.00 | 2.20 [1.95, 2.47] | yes | 1.44 | 1.39 [1.26, 1.54] | yes |
Two rows warrant comment. In the confounded no-loss cell (B_none) the frailty is doing real confounding work: the crude rate ratio in the enrolled ITT panel is 2.58, the IPW-weighted rate ratio 1.89, against a marginal truth of 1.98: the weighting removes essentially all of the planted confounding. In the discontinuation cell the two estimands separate as designed, with PP − ITT = +0.457 on the log scale against a true separation of +0.330: the per-protocol arm censors at deviation and reweights back to the sustained-treatment truth of 2.0, while the ITT arm retains post-discontinuation person-time and attenuates toward the do(initiate) truth. This cell also exercises the event-priority convention (1.3), since events and deviations collide in the same band whenever discontinuers have events in their final treated band.
Because a single pipeline run at a fixed seed cannot distinguish bias from draw-level noise, the two no-loss scenarios are repeated over eight independent seeds at 6,000 persons each, rerunning the complete pipeline per replicate:
| Scenario | Seed | Truth | PP IRR [95% CI] | covers | ITT IRR [95% CI] | covers |
|---|---|---|---|---|---|---|
| A | 5001 | 2.00 | 1.87 [1.67, 2.10] | yes | 1.87 [1.67, 2.10] | yes |
| A | 5002 | 2.00 | 2.09 [1.86, 2.33] | yes | 2.09 [1.86, 2.33] | yes |
| A | 5003 | 2.00 | 1.95 [1.74, 2.18] | yes | 1.95 [1.74, 2.18] | yes |
| A | 5004 | 2.00 | 1.87 [1.67, 2.09] | yes | 1.87 [1.67, 2.09] | yes |
| A | 5005 | 2.00 | 2.11 [1.88, 2.36] | yes | 2.11 [1.88, 2.36] | yes |
| A | 5006 | 2.00 | 1.95 [1.74, 2.18] | yes | 1.95 [1.74, 2.18] | yes |
| A | 5007 | 2.00 | 2.01 [1.79, 2.25] | yes | 2.01 [1.79, 2.25] | yes |
| A | 5008 | 2.00 | 1.86 [1.66, 2.08] | yes | 1.86 [1.66, 2.08] | yes |
| B | 5001 | 1.98 | 2.08 [1.84, 2.34] | yes | 2.08 [1.84, 2.34] | yes |
| B | 5002 | 1.98 | 1.94 [1.72, 2.19] | yes | 1.94 [1.72, 2.19] | yes |
| B | 5003 | 1.98 | 2.01 [1.79, 2.24] | yes | 2.00 [1.79, 2.24] | yes |
| B | 5004 | 1.98 | 1.65 [1.46, 1.86] | no | 1.65 [1.46, 1.86] | no |
| B | 5005 | 1.98 | 1.89 [1.68, 2.14] | yes | 1.89 [1.68, 2.14] | yes |
| B | 5006 | 1.98 | 2.10 [1.86, 2.37] | yes | 2.10 [1.86, 2.37] | yes |
| B | 5007 | 1.98 | 1.78 [1.58, 1.99] | yes | 1.78 [1.58, 1.99] | yes |
| B | 5008 | 1.98 | 2.19 [1.95, 2.46] | yes | 2.19 [1.95, 2.46] | yes |
| Scenario | Estimand | Mean log bias | MC sd | 95% CI coverage |
|---|---|---|---|---|
| A | pp | -0.020 | 0.049 | 8/8 |
| A | itt | -0.020 | 0.049 | 8/8 |
| B | pp | -0.018 | 0.094 | 7/8 |
| B | itt | -0.018 | 0.094 | 7/8 |
The mean log-scale bias is within Monte Carlo error of zero in both scenarios, and coverage is consistent with the nominal 95% at eight replicates. Individual misses, visible in Table 13, are the expected behaviour of honest intervals, not smoothed away.
3.6 Coverage calibration
The final layer asks whether the reported uncertainty can be trusted: over 200 replicate draws per scenario at 3,000 persons, each refit end to end, what fraction of nominal 95% intervals cover the truth? The study uses the per-protocol estimand estimated with the primary truncated weight (the pipeline’s default analysis exactly as reported). The per-protocol censoring weights (1.5) target the sustained-treatment effect in all three scenarios, including the informative loss in s3, so the three scenarios test whether the interval calibration survives the same nuisance that biases the intention-to-treat estimand.
| Scenario | Nuisances | Replicates fit | Mean log bias | MC sd | 95% CI coverage |
|---|---|---|---|---|---|
| s1 | none | 200/200 | -0.014 | 0.064 | 192/200 (96.0%) |
| s2 | confounding + independent loss | 200/200 | -0.011 | 0.079 | 195/200 (97.5%) |
| s3 | confounding + informative loss | 200/200 | +0.022 | 0.103 | 193/200 (96.5%) |
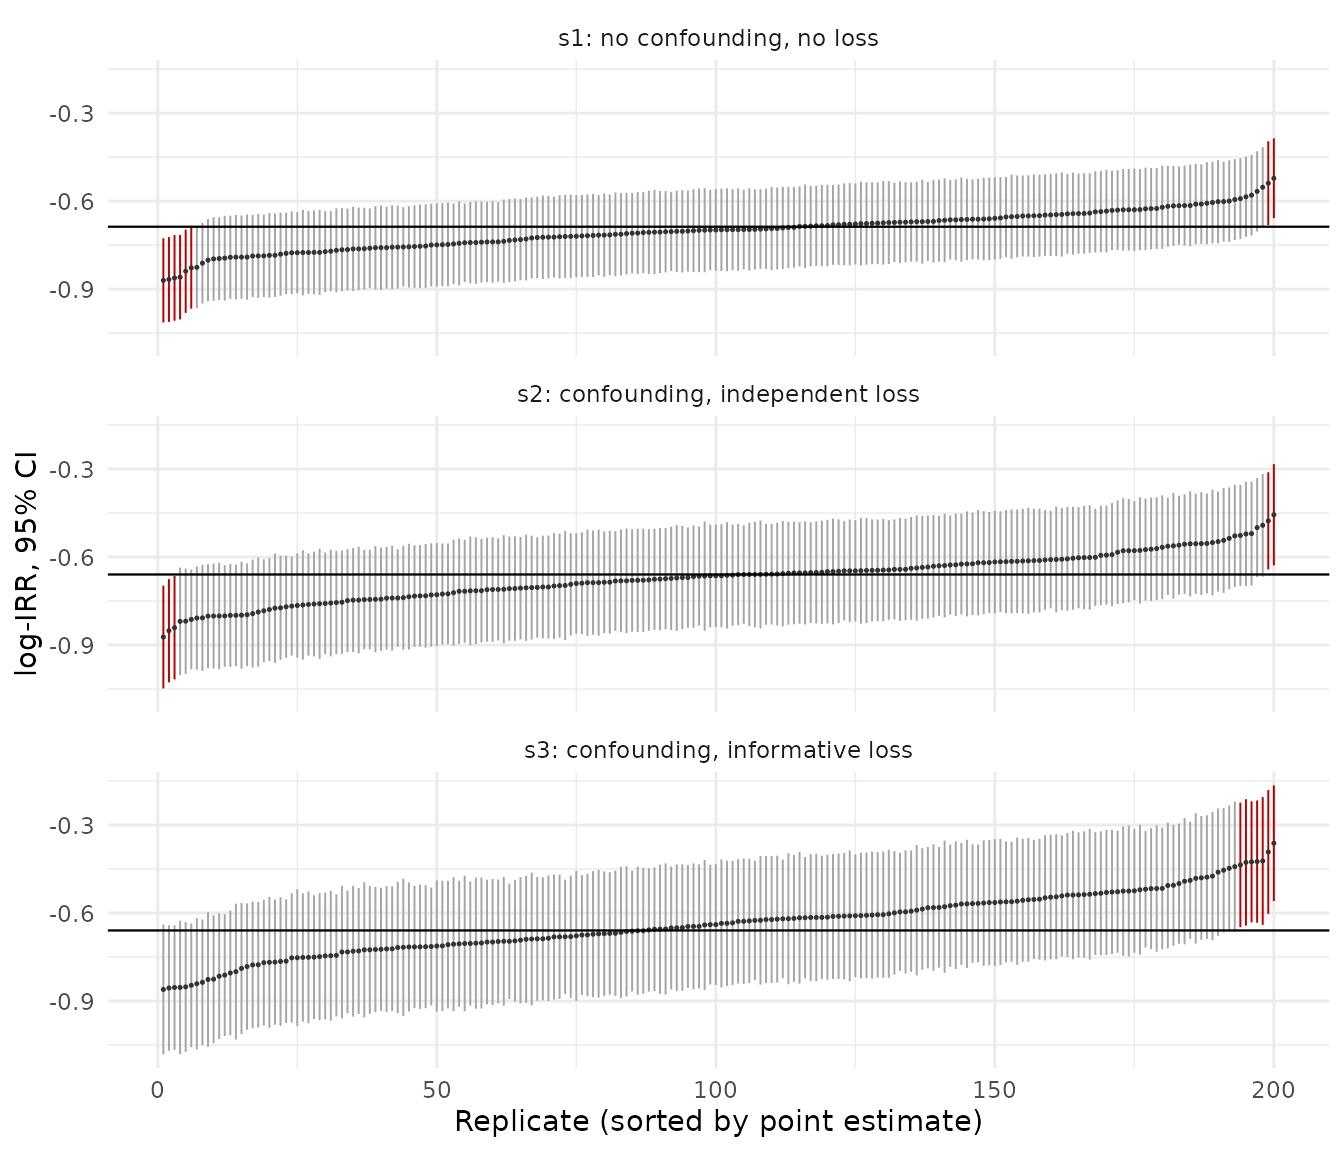
Figure 3. Coverage calibration: all 200 replicate 95% confidence intervals per scenario (per-protocol estimand, primary truncated weights), sorted by point estimate, against the true log-IRR (horizontal line). Intervals that miss the truth are drawn in red. Because the per-protocol censoring weights correct the informative loss, the interval cloud straddles the truth in every scenario — s1, s2, and s3 alike — with only the sampling-expected few percent of misses and none of the wholesale downward displacement the intention-to-treat estimand shows under the same loss.
Across all three scenarios the per-protocol interval stays close to nominal: 96.0% in s1, 97.5% under confounding with independent loss (s2), and 96.5% under informative loss (s3). The censoring weights (1.5) remove the selection that informative loss induces, so the s3 point estimate carries only +0.022 mean bias (Table 15), so intervals of the correct width cover the truth rather than missing systematically as the estimate distribution shifts away from it. The mild departures in s1 and s2 are the expected consequence of treating estimated weights as fixed (1.8). This is the payoff of being specific about the estimand: under the same informative loss the intention-to-treat interval degrades, because no variance estimator can repair a point estimate the estimand itself leaves biased — whereas the per-protocol interval, built around an unbiased estimate, remains calibrated.
3.7 Marginal versus conditional estimands
swereg and TrialEmulation both remove baseline
confounding, but by different routes, producing two distinct and each
valid estimands. swereg weights and fits a covariate-free model: a
marginal effect. TrialEmulation conventionally adjusts the
outcome model: a conditional effect. Rate ratios are collapsible, so
these coincide for the IRR; odds ratios are not, so the
TrialEmulation OR is converted with the Zhang–Yu relation
,
where
is the reference-arm per-period risk, before comparison. The conversion
removes the scale gap only; a residual conditional-versus-marginal
difference remains, visible in Table 4 as the small swereg − TE gaps in
the confounded scenarios (larger for ITT than for PP). The primary
correctness guarantee is each implementation’s agreement with the known
simulated truth on its own scale. Section 3.8 measures where each
route’s advantage holds, and where both end.
3.8 Boundary of validity: the truncation tradeoff across scenarios
The s3 per-protocol cell raised two questions a single scenario cannot answer: is the conditional-adjustment route always the better one, and is truncation always a cost? This section varies the design one knob at a time around the s3 configuration: the strength of the loss’s dependence on the confounder (0.45, 0.9, 1.5 on ), its direction (−0.9, so that dropout selects low-risk rather than high-risk person-time), and the direction of the treatment effect (harmful, ), together with two mechanisms in which the selection is driven by an unmeasured prognostic factor (dropout on , and a healthy-adherer mechanism in which treated individuals with high discontinue preferentially), plus a separate data-generating process in which censoring is driven by a time-varying covariate that treatment itself affects. Per-protocol estimand throughout; ten paired replicates per cell.
| Cell | Datasets | Person-periods lost | True log-IRR | swereg truncated: mean bias (MC SE) | swereg untruncated: mean bias (MC SE) | TrialEmulation: mean bias (MC SE) |
|---|---|---|---|---|---|---|
| informative loss, mild (0.45·L0) | 10 | 51% | -0.659 | +0.025 (0.008) | -0.006 (0.010) | -0.012 (0.008) |
| informative loss, base (0.9·L0, = s3) | 10 | 50% | -0.659 | +0.052 (0.011) | +0.024 (0.020) | -0.019 (0.012) |
| informative loss, harsh (1.5·L0) | 10 | 50% | -0.659 | +0.090 (0.014) | +0.075 (0.022) | +0.009 (0.010) |
| informative loss, reversed (−0.9·L0) | 10 | 50% | -0.659 | -0.003 (0.010) | -0.026 (0.014) | -0.030 (0.007) |
| harmful effect (+0.7), informative loss | 10 | 50% | 0.639 | -0.041 (0.006) | -0.099 (0.019) | +0.030 (0.005) |
| unmeasured loss driver (0.9·U) | 10 | 50% | -0.637 | -0.039 (0.010) | -0.049 (0.010) | -0.059 (0.012) |
| unmeasured adherence driver (healthy-adherer) | 10 | 0% | -0.637 | -0.021 (0.009) | -0.037 (0.010) | -0.050 (0.009) |
Some features of the s3 result generalise; the ranking does not. The
dose–response is systematic: swereg’s truncated-weight bias grows
monotonically with the informativeness of the loss, and at the harshest
setting even the untruncated fit degrades, because under extreme
selection the censoring weights become difficult to estimate. The
weighting route’s difficulty is therefore continuous in selection
strength rather than a truncation artifact alone. The conditional route
(TrialEmulation, no censoring weights, baseline covariate
in the outcome model) is unaffected across the dose–response, but only
because this loss is driven exactly by the covariate it conditions on.
No uniform ranking generalises. With the selection reversed, the
residual changes sign, partially cancels the truncation shift, and
truncated swereg lands nearest the truth of all three fits; with a
harmful effect, truncation partially offsets the downward drag that
depletion of susceptibles plus late-follow-up up-weighting produces, and
the untruncated fit is the worst of the three. Neither package, and
neither weight variant, dominates across the grid.
The two unmeasured-driver cells locate the boundary set by assumption (5) of the analysis plan (1.9). In both, every fit is displaced together and in the same direction, toward an exaggerated protective effect: with dropout on the unmeasured factor, swereg truncated -0.039, untruncated -0.049, TrialEmulation -0.059; with the unmeasured factor driving adherence, -0.021, -0.037, and -0.050 respectively. No weighting or conditioning on measured covariates corrects selection on an unobserved variable. Two further observations. First, the displacement in the unmeasured-loss cell contradicts the intuition that dropout independent of treatment should cancel between arms in a ratio: events deplete high-risk person-time faster in the comparator arm, so an identical dropout process interacts differently with the two arms’ risk sets, and the ratio does not escape. Second, the truncated and untruncated estimates differ far less in these cells than in the measured-covariate cells: the truncated-versus- untruncated divergence responds to weight instability arising from measured covariates and remains largely silent about unmeasured drivers, whose detection requires design-based approaches (negative-control outcomes, sensitivity analyses for unmeasured selection) rather than weight diagnostics.
| Datasets | True log-IRR | swereg IPCW, time-updated covariate: mean bias (MC SE) | swereg IPCW, covariate frozen at baseline: mean bias (MC SE) | TrialEmulation, baseline conditioning: mean bias (MC SE) |
|---|---|---|---|---|
| 10 | -1.195 | +0.251 (0.012) | +0.299 (0.012) | +0.183 (0.016) |
Table 17 is the boundary the SAP declares in 1.9, now measured: when the determinants of censoring are time-varying and affected by treatment, every configuration of either package (time-updated censoring weights, frozen covariates, or baseline conditioning) is biased by an order of magnitude more than anywhere else in this battery. All three estimates are therefore unusable, and comparing them identifies only which approach fails least, not an approach that works. No setting available within this pipeline (different truncation percentiles, covariate sets, or censoring-model specifications) repairs the problem, because the difficulty is structural. When a time-varying confounder is itself affected by earlier treatment, valid estimation requires methods designed for that feedback, such as the parametric g-formula or g-estimation of structural nested models (Hernán and Robins 2016), which this pipeline does not implement.
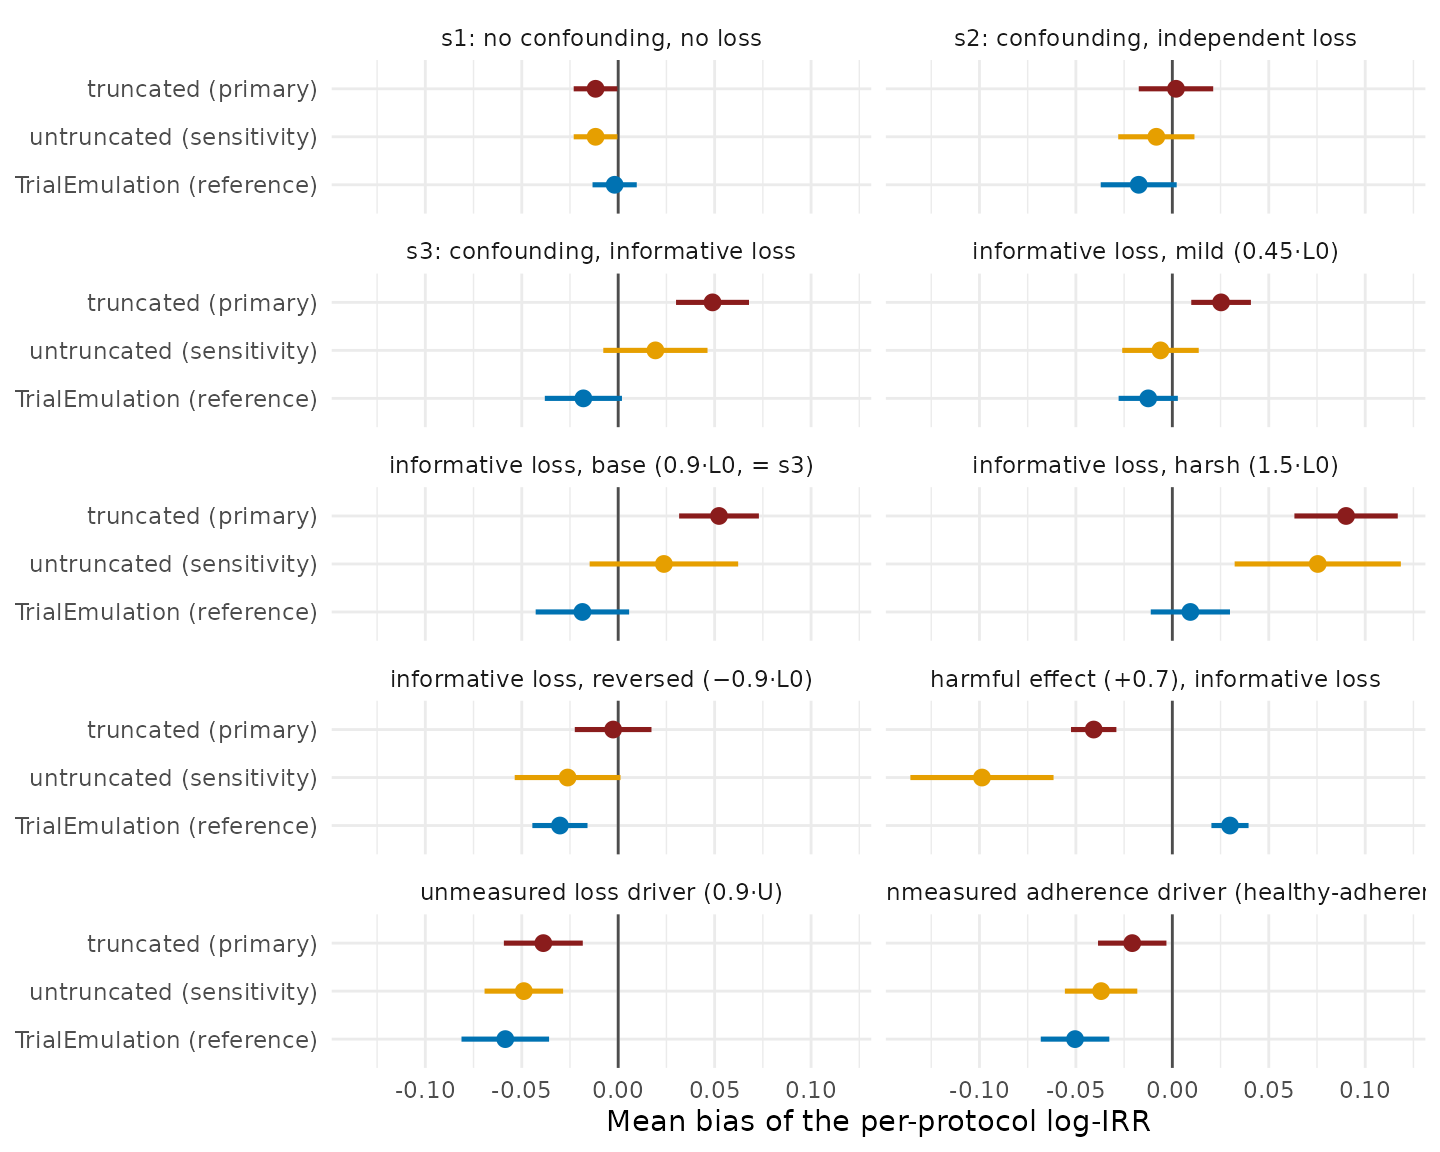
Figure 4. Mean bias of the per-protocol log-IRR across every validation cell (s1–s3: 20 datasets each; the Table 16 grid cells: 10 each), one panel per scenario, with 95% Monte Carlo intervals; the vertical line marks zero. Both swereg weight variants are shown together with TrialEmulation as the conditional-adjustment reference (a different estimation route, not a third weight variant: baseline covariate in the outcome model, no censoring weights, odds ratios converted to the rate-ratio scale). Truncation introduces bias where informative loss makes the censoring weights heavy-tailed (compare the mild, base, and harsh cells), has no measurable effect where the weight distribution is stable (s1, s2), and in the reversed-selection and harmful-effect cells the truncated fit is the least biased of the three.
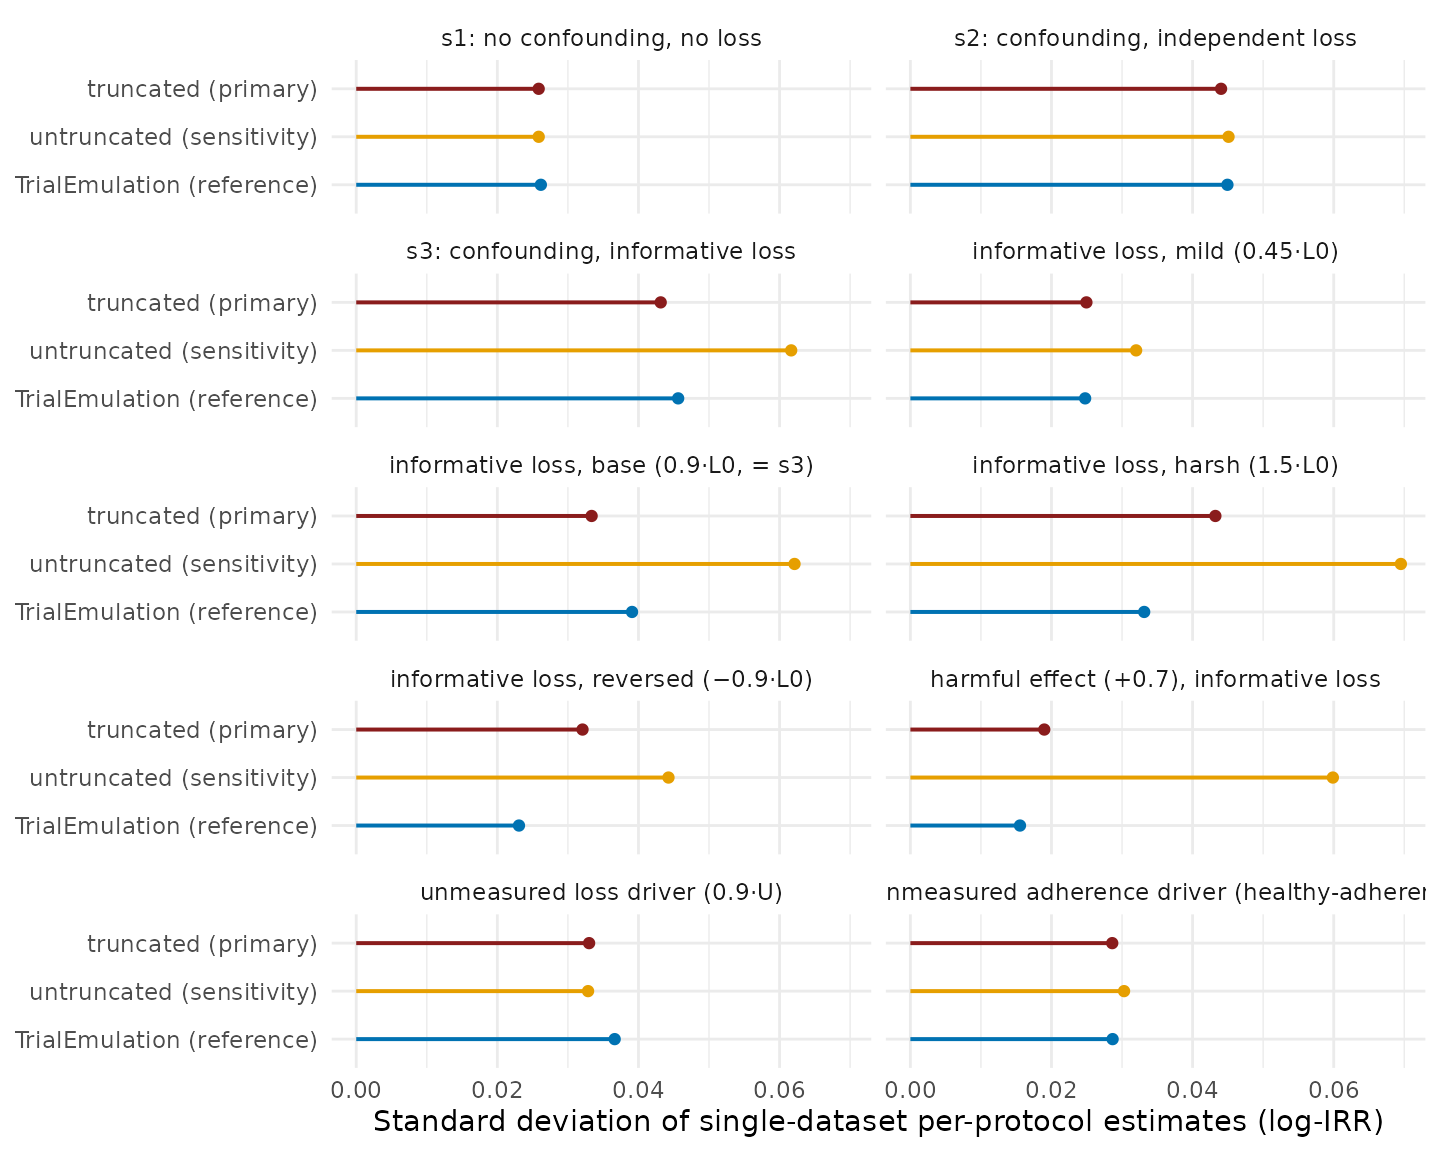
Figure 5. Spread of the same per-protocol estimates: the standard deviation across replicate datasets, the sampling noise an analyst running one study draws from. One panel per scenario, with bars anchored at zero; TrialEmulation is shown as the conditional-adjustment reference. Truncation reduces this component of error: the truncated fit has the smaller spread of the two swereg variants in every scenario, by up to a factor of three where the weights are most extreme (harmful-effect cell).
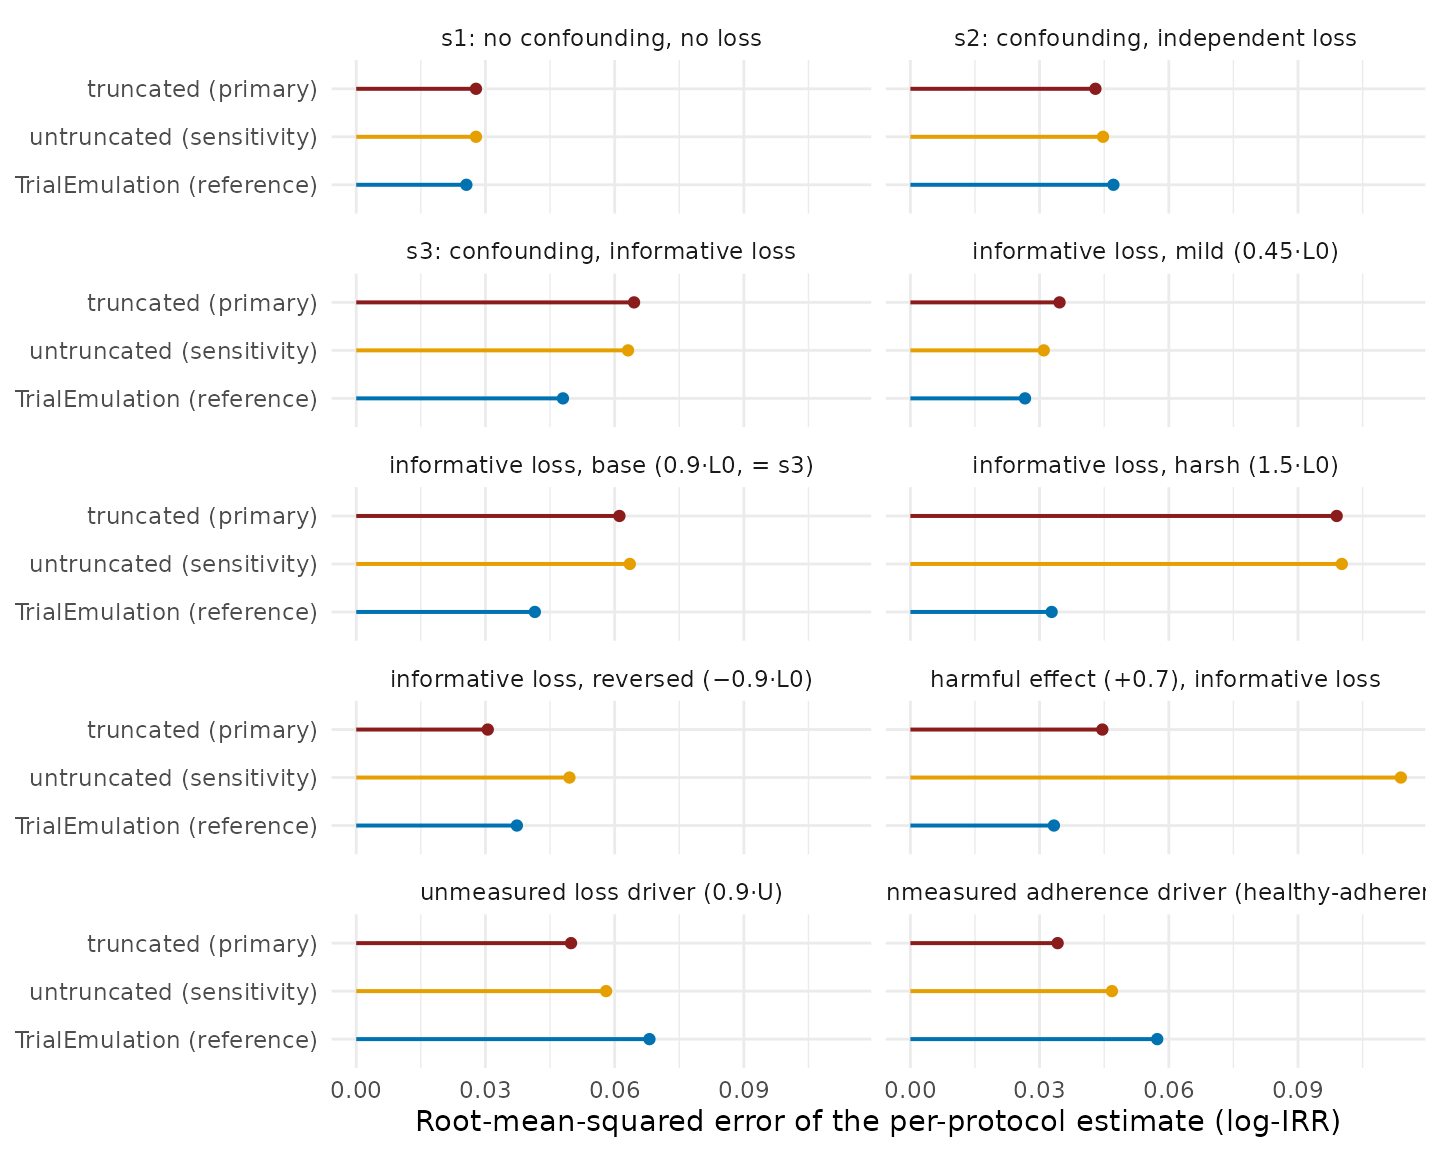
Figure 6. Root-mean-squared error, combining bias (Figure 4) and spread (Figure 5) as the two components of the bias–variance tradeoff: the expected error of a single study’s per-protocol estimate, and the criterion on which the primary analysis is chosen. One panel per scenario, with bars anchored at zero; TrialEmulation is shown as the conditional-adjustment reference. Of the two swereg variants, the truncated fit has lower or practically equal error in every scenario, with the largest advantage where the untruncated weights are unstable (harmful-effect cell); relative to the reference, no estimation route has uniformly lower error across scenarios.
The recommendation follows from Figure 6, not from either ingredient alone (Figures 4 and 5). Truncation lowers the spread of single-dataset estimates in 9 of the 10 per-protocol cells, and has the lower RMSE in 8 of them: neither variant is uniformly better, and the cells in which each has the lower error are those its mechanism predicts. The pipeline’s convention is therefore retained on the evidence: the truncated fit is the primary analysis (its error is stable and bounded across every regime tested), the untruncated fit is always exported alongside (1.6), and a material divergence between the two indicates that the censoring weights are unstable. The appropriate responses are then sensitivity analyses at looser truncation percentiles (Table 9 quantifies the dose–response), restriction of the eligible population where extreme weights are structural, or, when the censoring drivers are time-varying and treatment-affected, the recognition that no weighting scheme in this pipeline suffices (Table 17).
4. Implementation mapping
The SAP (Section 1) is deliberately implementation-agnostic. This section reveals the code: which function, argument, and option realises each step, the provenance of estimator-behaviour changes, and where the validation evidence comes from.
4.1 SAP step → code
| SAP | Step | Implementation |
|---|---|---|
| 1.1 | Band width |
period_width (default 4 weeks) in the
trial-band assignment inside TTEPlan
|
| 1.1 | Sequential eligibility, enrollment, matching |
TTEPlan$s1_generate_enrollments_and_ipw();
matching_ratio and seed from the YAML spec’s
treatment.implementation
|
| 1.1 | Washout / new-user exclusion | Spec-level exclusion:
type: no_prior_intervention with
window: lifetime_before_baseline, or a finite
window in weeks |
| 1.1 | Prevalent-user warning |
tteplan_read_spec() warns when a spec
lacks a washout exclusion; silence with
options(swereg.warn_prevalent_user = FALSE)
|
| 1.3 | Follow-up stop events, event priority |
TTEEnrollment$s5_prepare_outcome();
horizon from follow_up, administrative end of study from
admin_censor_isoyearweek
|
| 1.4 | Hot-deck imputation | TTEEnrollment$s1_impute_confounders(seed = 4) |
| 1.4 | Stabilised IPW | TTEEnrollment$s2_ipw(stabilize = TRUE) |
| 1.5 | IPCW censoring model |
TTEEnrollment$s6_ipcw_pp() via
s4_prepare_for_analysis(estimate_ipcw_pp_with_gam = TRUE, estimate_ipcw_pp_separately_by_treatment = TRUE);
GAM engine mgcv::bam(..., discrete = TRUE);
estimate_ipcw_pp_with_gam = FALSE gives the linear-in-time
sensitivity variant |
| 1.6 | Weight truncation |
TTEEnrollment$s3_truncate_weights(lower = 0.01, upper = 0.99);
truncated columns ipw_trunc (ITT) and
analysis_weight_pp_trunc (PP product weight); untruncated
PP results exported as a sensitivity sheet |
| 1.7–1.8 | Outcome model + inference |
TTEEnrollment$irr(weight_col):
survey::svydesign(ids = ~person) +
survey::svyglm(family = quasipoisson()) with
splines::ns() terms for follow-up and trial index |
| 1.10 | Pre-specification | YAML spec parsed by tteplan_read_spec();
full grid run by
TTEPlan$s1_…/s2_…/s3_analyze()
|
4.2 Provenance notes
- Event-priority convention (1.3). Enforced since swereg 26.7.3. Previously, a first event falling in the same band as the first protocol deviation was dropped as a censoring, which undercounted per-protocol events in switching-heavy data (≈10% of PP events in a high-switching simulation; negligible under strong persistence).
-
Per-person administrative censoring.
admin_censor_var(a per-person censoring column) is accepted by the constructor for backward compatibility but is not implemented in outcome preparation and now errors loudly rather than silently doing nothing; useadmin_censor_isoyearweek.
4.3 Where the validation numbers come from
The evidence layers in Section 3 are permanent, executable tests:
| Section | Layer | Test file | Gate |
|---|---|---|---|
| 3.3 | Cross-package triangle | tests/testthat/test-tte_validation_matrix.R |
runs in CI |
| 3.4 | Stress matrix | tests/testthat/test-tte_stress_matrix.R |
fast subset in CI; full battery
SWEREG_RUN_STRESS=true
|
| 3.5 | Plan-layer truth matrix | tests/testthat/test-tteplan_truth_matrix.R |
reduced-N subset in CI; full factorial
SWEREG_RUN_PLAN_MATRIX=true
|
| 3.6 | Coverage calibration | tests/testthat/test-tte_coverage.R |
opt-in only, SWEREG_RUN_COVERAGE=true
|
The tables and figures themselves are rendered from
vignettes/tte-validation-evidence.rds, regenerated by
dev/generate_validation_evidence.R (in the source
repository, not the installed package). The script reruns every cell
through the same DGP/truth/fit helpers the tests source
(tests/testthat/helper-tte_*.R), so the vignette’s numbers
and the suite’s assertions cannot drift apart; rerun it after any
estimator change and commit the refreshed artifact alongside.
References
- Hernán MA, Robins JM. Observational studies analyzed like randomized experiments: an application to postmenopausal hormone therapy and coronary heart disease. Epidemiology 2008;19(6):766–779.
- Hernán MA, Robins JM. Using big data to emulate a target trial when a randomized trial is not available. Am J Epidemiol 2016;183(8):758–764.
- Danaei G, García Rodríguez LA, Cantero OF, Logan R, Hernán MA. Observational data for comparative effectiveness research: an emulation of randomised trials of statins and primary prevention of coronary heart disease. Stat Methods Med Res 2013;22(1):70–96.
- Caniglia EC, et al. Emulating a sequence of target trials to avoid immortal time bias: an application in pregnancy. Am J Epidemiol 2023.
- Cashin AG, et al. Emulating a target trial — the TARGET statement. JAMA 2025.
- Thompson WA Jr. On the treatment of grouped observations in life studies. Biometrics 1977;33(3):463–470.
- Su L, Rezvani R, Seaman SR, Bartlett JW. TrialEmulation: An R package to emulate target trials for time-to-event data from electronic health records. arXiv:2402.12083, 2024.
- Zhang J, Yu KF. What’s the relative risk? A method of correcting the odds ratio in cohort studies of common outcomes. JAMA 1998;280(19):1690–1691.